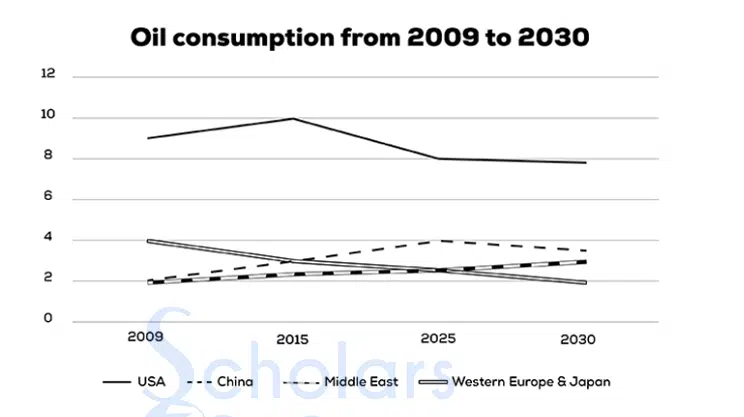
14. The graph below shows information about the total oil consumption of four major consumers from 2009 to 2030.
Instructions: You should spend about 20 minutes on this task. Write at least 150 words.
This quiz is for logged in users only.
Username or Email Address
Password
Remember Me
Time's up
Time is Up!
Tip: Make sure to:
Back to Mock Test →
This website is currently optimized for laptop and desktop devices only.
Please open this website from a computer to access all features properly.