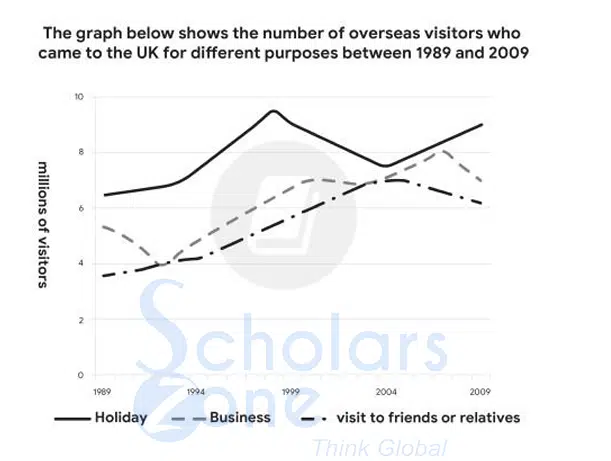
05.The graph below shows the number of overseas visitors who came to the UK for different purposes between 1989 and 2009.
Instructions: You should spend about 20 minutes on this task. Write at least 150 words.
This quiz is for logged in users only.
Username or Email Address
Password
Remember Me
Time's up
Time is Up!
Tip: Make sure to:
Back to Mock Test →
This website is currently optimized for laptop and desktop devices only.
Please open this website from a computer to access all features properly.