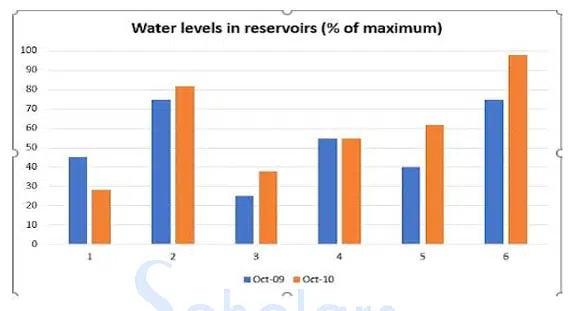
12. The chart shows the water levels of 6 cities in Australia {Darwin (1), Sydney (2), Melbourne (3). Brisbane (4), Perth (5) and Canberra (6)} in October 2009 and October 2010
Instructions: You should spend about 20 minutes on this task. Write at least 150 words.