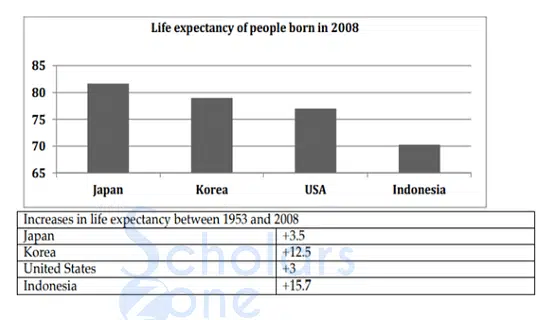
03. The bar chart gives information about the life expectancy in Japan, Korea, the United States, and Indonesia, and the table shows the change in life expectancy between 1953 and 2008.
Instructions: You should spend about 20 minutes on this task. Write at least 150 words.