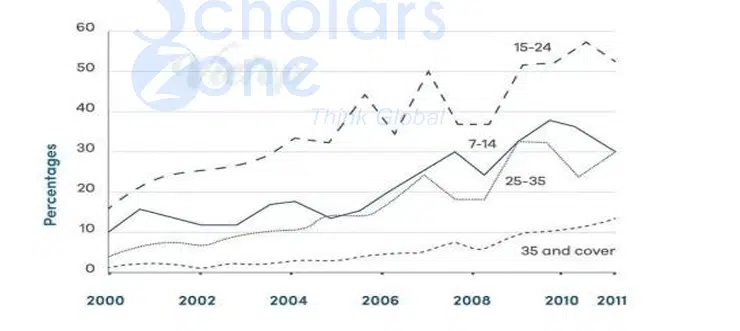
16. The line graph b14. The line chart shows average attendance at the cinema among various age groups in the US from 2000 to 2011elow shows the production of paper, wood pulp and sawnwood in the UK from 1980 to 2000.
Instructions: You should spend about 20 minutes on this task. Write at least 150 words.